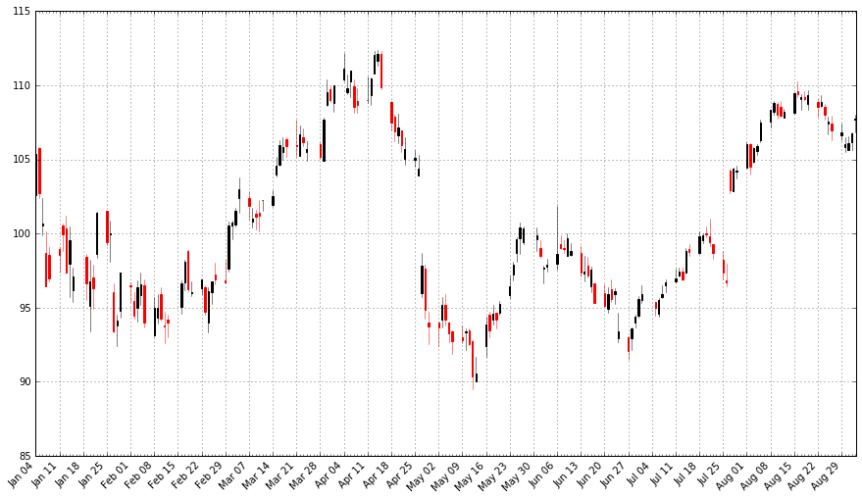
If you’re new to doing data analysis and Python, Curtis Miller put together two great posts from one of his collegiate lectures. They show how to leverage Python, the Pandas library and open source data to conduct an analysis. In this case he’s looking at stocks and their performances. You can do a similar analysis of some stocks you are interested in and see what you can come up with!
This post is the first in a two-part series on stock data analysis using Python, based on a lecture I gave on the subject for MATH 3900 (Data Science) at the University of Utah.
Source: An Introduction to Stock Market Data Analysis with Python (Part 1)
This post is the second in a two-part series on stock data analysis using Python, based on a lecture I gave on the subject for MATH 3900 (Data Mining) at the University of Utah.
Source: An Introduction to Stock Market Data Analysis with Python (Part 2)

I have been searching for the actual code. Is it available anywhere?
If I copy and paste from his article, the code is full of non-ASCII characters that I have been unable to remove without destroying formatting.
LikeLike